Price Action Indicators
Price Action Indicators
Couldn't load pickup availability
📌 Product Overview
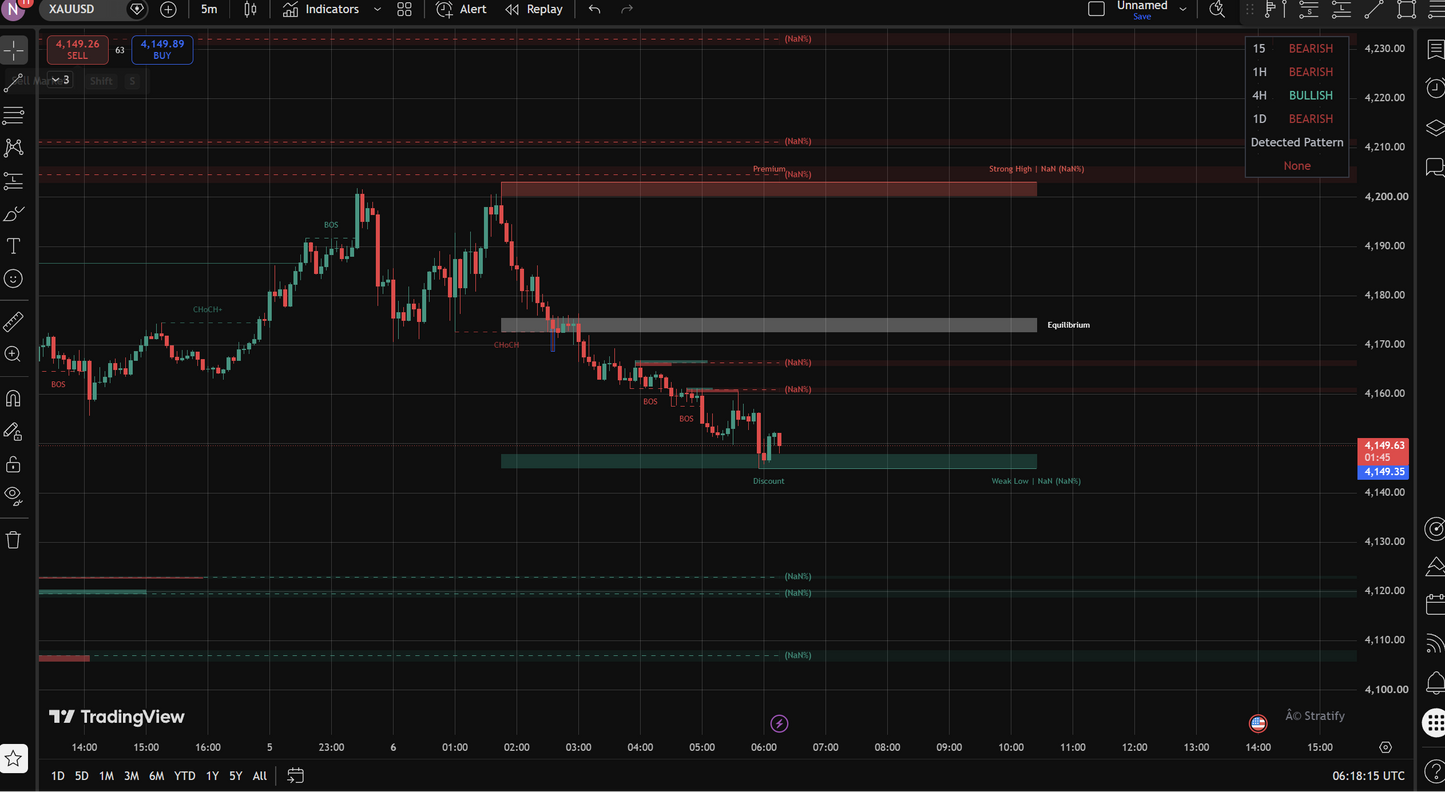
Price Action Concepts is a comprehensive professional-grade TradingView indicator that combines institutional trading methodologies into one powerful tool. Built for serious traders who understand that price action is the foundation of all successful trading strategies.
🎯 What It Does
This indicator automatically identifies key market structures, liquidity zones, order blocks, and high-probability trading opportunities that would typically take hours of manual chart analysis to find.
🔑 Key Features
1. Market Structure Analysis
-
Automatic BOS/CHoCH Detection - Instantly spot trend continuations and reversals
-
Swing & Internal Structures - Multiple timeframe analysis for better context
-
Dynamic Adjustment - Auto-adapts to market volatility
-
MTF Scanner - See 15m, 1H, 4H, and 1D trends at a glance
2. Liquidity Concepts
-
HH/HL/LL/LH Detection - Identifies all major swing points
-
Liquidity Sweep Tracking - See where stops were taken
-
Validity Controls - Customize how long sweeps remain valid
-
Visual Boxes - Clear visual representation of swept zones
3. Volumetric Order Blocks
-
Smart Money Zones - Identifies where institutions are active
-
Volume Metrics - Shows buy/sell pressure within each block
-
Mitigation Tracking - Blocks auto-remove when price reaches them
-
Customizable Positioning - Full, Middle, Accurate, or Precise
4. Fair Value Gaps (FVG)
-
Three Types - FVG, VI (Volume Imbalance), OG (Order Gap)
-
Multi-Timeframe - Display gaps from higher timeframes
-
Auto-Mitigation - Removes when price fills the gap
-
Extend Option - Control how far gaps display
5. Accumulation & Distribution Zones
-
Pattern Recognition - Automatically finds "W" and "M" patterns
-
Fast/Slow Modes - Choose detection speed vs accuracy
-
Clear Visuals - Highlighted zones with polyline connections
6. High/Low/Equilibrium (HLE)
-
Premium/Discount Zones - Identify overbought/oversold areas
-
Equilibrium Levels - Find fair value zones
-
Volume Confirmation - See strong vs weak levels
-
Dynamic Updates - Real-time price positioning
7. Equal Highs & Lows
-
EQH/EQL Detection - Find important support/resistance clusters
-
ATR-Based Tolerance - Dynamic adjustment for different markets
📊 Visual Output
What You See on Chart:
-
Color-coded structure lines (Green for bullish, Red for bearish)
-
Liquidity boxes showing swept levels
-
Order block zones with volume metrics
-
FVG zones with gap information
-
Premium/Equilibrium/Discount zones
-
MTF trend table (15m, 1H, 4H, 1D)
-
Structure labels (BOS, CHoCH, CHoCH+)
-
Swing point labels (HH, HL, LL, LH)
-
Volume metrics inside order blocks
⚙️ Key Settings
| Category | Key Settings |
|---|---|
| Liquidity | Pivot Length (2-50), Validity Period |
| Structure | Swing/Internal Lookbacks, Manual/Dynamic Mode |
| Order Blocks | Number to Show, Positioning, Mitigation Type |
| FVG | Type (FVG/VI/OG), Timeframe, Extend Length |
| Zones | Fast/Slow Mode, Colors |
| Colors | Fully customizable for all elements |
| Display | Toggle any feature on/off |
🚨 Alert System
20+ Alert Conditions including:
-
✅ Bullish/Bearish BOS
-
✅ Bullish/Bearish CHoCH
-
✅ Bullish/Bearish CHoCH+
-
✅ Swing BOS & CHoCH+
-
✅ Equal Highs/Lows
-
✅ Bullish/Bearish FVG
-
✅ Order Block Formations
-
✅ Accumulation/Distribution Zones
-
✅ Liquidity Grabs
💡 How to Use It
For Bullish Bias:
-
Look for BOS or CHoCH breaks upward
-
Price entering green Order Block
-
Price in Discount Zone (bottom third)
-
Accumulation pattern forming
-
EQL (Equal Lows) support level
For Bearish Bias:
-
Look for BOS or CHoCH breaks downward
-
Price entering red Order Block
-
Price in Premium Zone (top third)
-
Distribution pattern forming
-
EQH (Equal Highs) resistance level
🎯 Who Is This For?
-
Day Traders - Quick structure analysis
-
Swing Traders - Multi-timeframe context
-
Futures/Crypto Traders - Liquidity and order block focus
-
Professional Traders - Institutional-style analysis
-
Price Action Specialists - Clean, uncluttered charts
⭐ Key Benefits
Save Time
-
Automates hours of manual chart analysis
-
No need to draw structure lines manually
-
Instant liquidity zone identification
Improve Accuracy
-
Eliminates subjective interpretation
-
Consistent, rule-based signals
-
Confirmed by multiple confluences
Trade Better
-
Know where smart money is active
-
See potential reversal zones
-
Understand market context instantly
Stay Informed
-
Real-time alerts for key events
-
Multi-timeframe trend overview
-
Volume metrics for confirmation
Share